> ## Documentation Index
> Fetch the complete documentation index at: https://docs.pricemedic.com/llms.txt
> Use this file to discover all available pages before exploring further.
# Finalizing Your Report
> Confirm your selections before generating your report
 ## Basics
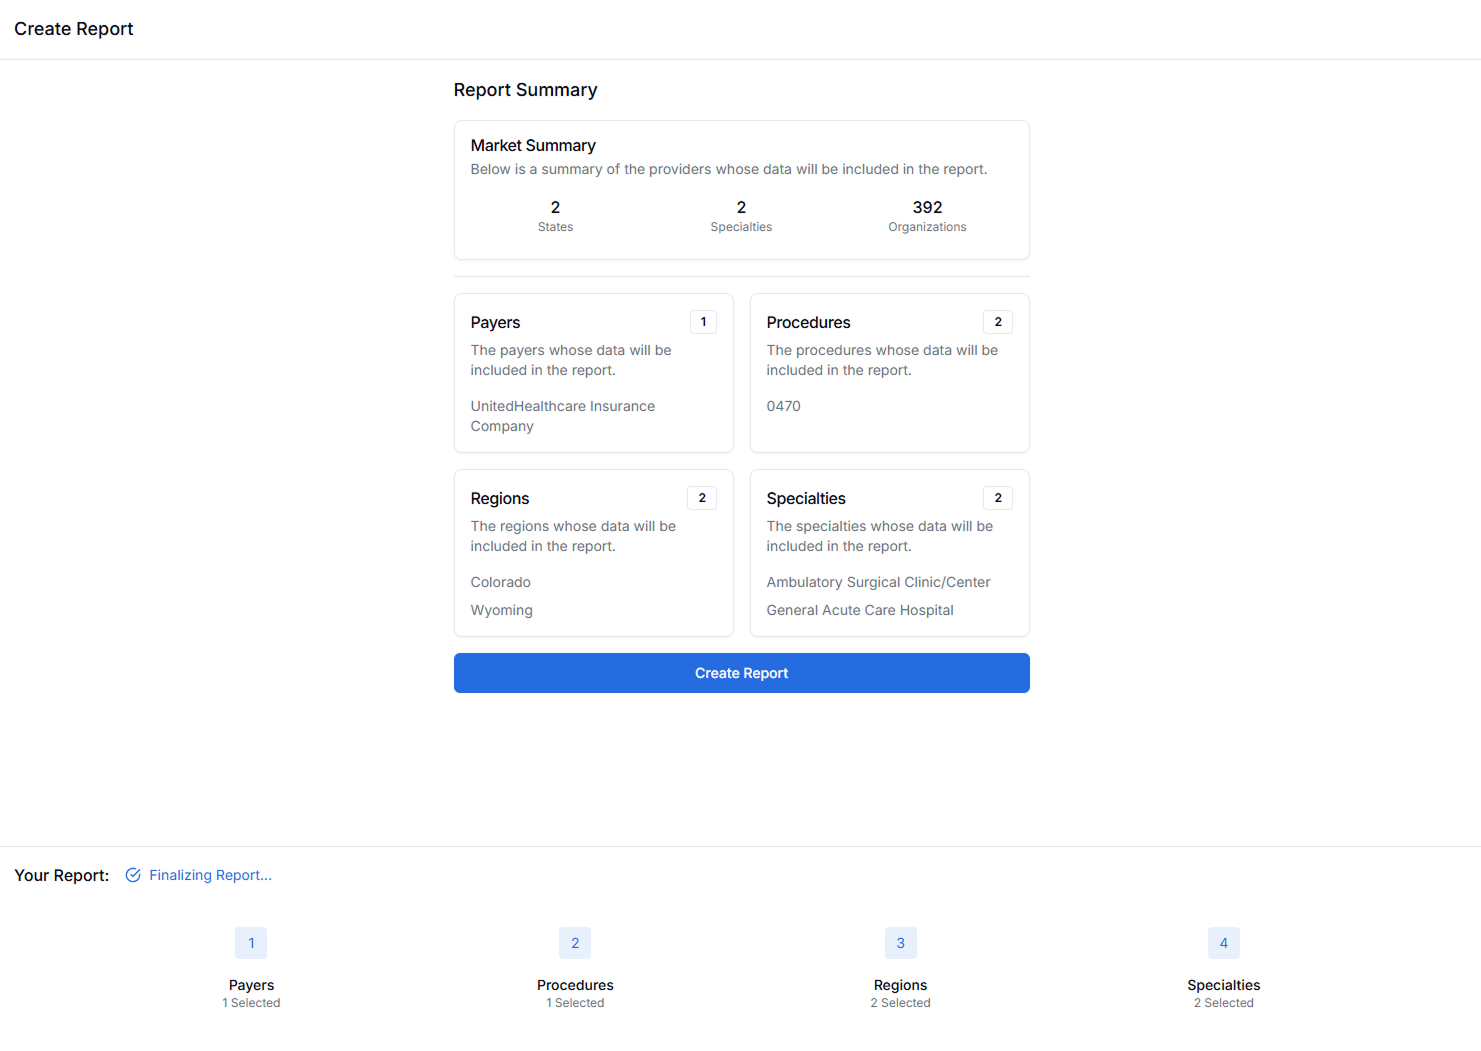
Confirm your selections before generating your report.
Review your parameters for **Payers**, **Procedures**, **Regions**, and **Specialties** to be included in the final report.
In the **Market Summary** section, ensure there are a reasonable number of organizations to be included in the report, or else consider altering one or more of your report filters to narrow or broaden the scope of your market.
Select **Create Report** to generate the final product.
Depending on the size of the report, it can take up to 2 minutes to load.
## Review Checklist
Before finalizing your report, verify the following:
✅ **Confirm payer selection aligns with your analysis goals**
* Single payer for interactive analysis
* Multiple payers for export and external analysis
* All relevant networks included
✅ **Verify procedure selection is comprehensive**
* All relevant billing codes included
* Appropriate filters applied
* Both institutional and professional codes if needed
✅ **Ensure regional coverage matches your needs**
* Target markets included
* National vs. state-specific scope appropriate
* Sufficient geographic coverage for analysis
✅ **Confirm specialties are appropriate for procedures**
* Relevant taxonomy codes selected
* Broad enough coverage for meaningful data
* Specific enough to avoid irrelevant providers
✅ **Review Market Summary metrics**
* Sufficient number of organizations for analysis
* Reasonable scope for report performance
* Expected data availability confirmed
## Market Summary Interpretation
The Market Summary section provides key metrics about your report scope:
### Organization Count
* **High count (greater than 1000)**: Comprehensive market coverage, may affect performance
* **Moderate count (100-1000)**: Good balance of coverage and performance
* **Low count (less than 100)**: May need to broaden scope for meaningful insights
### Network Coverage
Shows the total number of insurance networks included across your selected payers.
### Provider Coverage
Indicates the number of contracted providers that meet your specialty and regional criteria.
## Optimization Tips
If your Market Summary shows a very high organization count:
* Consider narrowing geographic scope
* Focus on specific specialties rather than broad categories
* Split into multiple smaller reports for better performance
If your Market Summary shows low numbers:
* Expand geographic scope (add more states or select National)
* Include broader specialty categories
* Add related subspecialties to increase provider coverage
* Consider additional payers if available
**For interactive analysis**:
* Keep organization count moderate for best performance
* Focus on single payers when possible
**For data export**:
* Larger reports are acceptable since you'll be analyzing externally
* Consider comprehensive multi-payer reports for complete market view
## After Report Creation
Once your report is generated, you can:
* **Analyze data interactively** using PriceMedic's built-in analytics tools
* **Apply additional filters** to refine your analysis
* **Export data** to CSV for external analysis
* **Share insights** with your team
* **Create additional reports** with different parameters
Save your successful report configurations for easy replication with updated data or slight modifications.
## Need Help?
If you encounter issues during report generation or need assistance optimizing your report parameters, contact [support@pricemedic.com](mailto:support@pricemedic.com).
## Next Steps
Congratulations! You've completed the report creation process. Your generated report will provide comprehensive insights into reimbursement patterns for your selected parameters.
Consider exploring [Fee Schedule Creation](/guides/fee-schedules/01-creating-a-fee-schedule) for provider-specific analysis or return to the [Overview](/guides/report-creation/overview) to create additional reports with different parameters.
## Basics
Confirm your selections before generating your report.
Review your parameters for **Payers**, **Procedures**, **Regions**, and **Specialties** to be included in the final report.
In the **Market Summary** section, ensure there are a reasonable number of organizations to be included in the report, or else consider altering one or more of your report filters to narrow or broaden the scope of your market.
Select **Create Report** to generate the final product.
Depending on the size of the report, it can take up to 2 minutes to load.
## Review Checklist
Before finalizing your report, verify the following:
✅ **Confirm payer selection aligns with your analysis goals**
* Single payer for interactive analysis
* Multiple payers for export and external analysis
* All relevant networks included
✅ **Verify procedure selection is comprehensive**
* All relevant billing codes included
* Appropriate filters applied
* Both institutional and professional codes if needed
✅ **Ensure regional coverage matches your needs**
* Target markets included
* National vs. state-specific scope appropriate
* Sufficient geographic coverage for analysis
✅ **Confirm specialties are appropriate for procedures**
* Relevant taxonomy codes selected
* Broad enough coverage for meaningful data
* Specific enough to avoid irrelevant providers
✅ **Review Market Summary metrics**
* Sufficient number of organizations for analysis
* Reasonable scope for report performance
* Expected data availability confirmed
## Market Summary Interpretation
The Market Summary section provides key metrics about your report scope:
### Organization Count
* **High count (greater than 1000)**: Comprehensive market coverage, may affect performance
* **Moderate count (100-1000)**: Good balance of coverage and performance
* **Low count (less than 100)**: May need to broaden scope for meaningful insights
### Network Coverage
Shows the total number of insurance networks included across your selected payers.
### Provider Coverage
Indicates the number of contracted providers that meet your specialty and regional criteria.
## Optimization Tips
If your Market Summary shows a very high organization count:
* Consider narrowing geographic scope
* Focus on specific specialties rather than broad categories
* Split into multiple smaller reports for better performance
If your Market Summary shows low numbers:
* Expand geographic scope (add more states or select National)
* Include broader specialty categories
* Add related subspecialties to increase provider coverage
* Consider additional payers if available
**For interactive analysis**:
* Keep organization count moderate for best performance
* Focus on single payers when possible
**For data export**:
* Larger reports are acceptable since you'll be analyzing externally
* Consider comprehensive multi-payer reports for complete market view
## After Report Creation
Once your report is generated, you can:
* **Analyze data interactively** using PriceMedic's built-in analytics tools
* **Apply additional filters** to refine your analysis
* **Export data** to CSV for external analysis
* **Share insights** with your team
* **Create additional reports** with different parameters
Save your successful report configurations for easy replication with updated data or slight modifications.
## Need Help?
If you encounter issues during report generation or need assistance optimizing your report parameters, contact [support@pricemedic.com](mailto:support@pricemedic.com).
## Next Steps
Congratulations! You've completed the report creation process. Your generated report will provide comprehensive insights into reimbursement patterns for your selected parameters.
Consider exploring [Fee Schedule Creation](/guides/fee-schedules/01-creating-a-fee-schedule) for provider-specific analysis or return to the [Overview](/guides/report-creation/overview) to create additional reports with different parameters.